

Coordinated pacing gives frontier labs more time to recover existing investments before the next generation erodes their advantage.
Many well-intentioned people working inside frontier labs believe that AI poses an existential threat to human life. We do not doubt the sincerity of those convictions. The labs also have a strong financial incentive to slow frontier development.
Amodei proposes coordinated pacing “without sacrificing commercial advantage.”
The published plan calls for government-supported coordination and capability checkpoints. It announces Anthropic’s commitment to embedded independent reviewers with internal access and publication rights.
The proposal also calls for restrictions on Chinese access to compute, unauthorized distillation, and model-weight theft. The essay describes distillation as a way for lagging companies to catch up at a fraction of the cost of independent development.
A lab that slows alone leaves its rivals free to advance. Binding limits on those rivals reduce the competitive cost of waiting. The financial value of the proposal therefore depends on whether its rules constrain the competitors that threaten a lab’s lead.
Astra scores higher than Fable 5 at one-fifth the benchmark cost.
On September 13, GPT-6 Astra at high effort scores 51.05 at $1.72 per benchmark task; Fable 5 with fallback scores 49.70 at $8.75. [2]
When a cheaper model meets the same task requirements, the more expensive model needs another benefit to justify its premium. At unchanged serving costs, a price cut leaves less money from each task to repay the same development bill.
Historical price decline · Through 3 September 2026 · Index v4.1.1
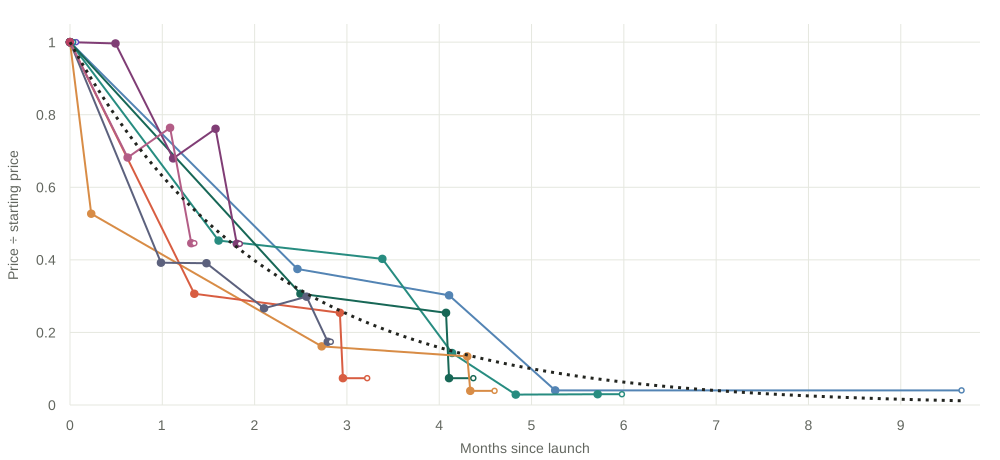
The cost of intelligence drops by half every 46 days.
Method, model histories & data
Each line tracks the lowest available price in a flagship model’s five-point score band, starting at that flagship’s launch. Prices are divided by their starting values, so 0.5 means half the original price. Dots mark price events, straight lines connect them, and open circles mark the end of each history. The dotted black curve is the average decline rate. This history does not measure changes in a lab’s revenue or profit.
The estimate uses five releases with at least 90 days of history. Each release contributes its full history, from 98 to 294 days; the cutoff does not shorten any line. Newer releases are shown with all available points, including the September 1–3 launches. GPT-5 is excluded from the estimate.
We fit an exponential decline to each older release’s daily price history, using log prices and a starting value of 1. We average the five decline rates and convert that rate to a half-life: 45.82 days. The displayed straight segments interpolate between price events.
Three releases in the estimate share the 55–60 score band, so their histories overlap. A band can include models scoring below the flagship. Requiring a model to match or beat the flagship’s exact score gives a half-life of 50 days; this is a sensitivity check, not an uncertainty interval.
The starting price can already be below the flagship’s own price. Before August 19, most prices are later observations dated back to launch, with some known price cuts added. Earlier prices and availability were not fully recorded. Scores use Artificial Analysis v4.1.1: the September 3 snapshot, plus Astra’s launch-day measurements from the September 4 morning archive. GPT-5’s price remains in the market comparison data.
| Release | Score band | Days | In fit |
|---|---|---|---|
| GPT-5.1 | 35–40 | 294 | Yes |
| GPT-5.4 | 50–55 | 182 | Yes |
| GPT-5.5 | 55–60 | 133 | Yes |
| Opus 4.7 | 55–60 | 140 | Yes |
| Opus 4.8 | 55–60 | 98 | Yes |
| GPT-5.6 Sol | 60–65 | 56 | No |
| Fable 5 | 60–65 | 86 | No |
| Opus 5 | 60–65 | 41 | No |
| Fable 5.1 | 65–70 | 2 | No |
| Gemini 3.8 Flash | 55–60 | 1 | No |
| Muse Spark 1.3 | 60–65 | 1 | No |
| GPT-6 Astra | 60–65 | 0 | No |
Download the plotted data (JSON) · Benchmark methodology ↗
The current comparisons come from the September 13 Pareto-frontier snapshot, covering 41 configurations on Index v4.3. They measure benchmark performance and task cost; actual customer switching and provider profitability remain unknown. Their raw scores and task costs cannot be compared with the historical v4.1.1 graph. We checked the four configurations cited here against Artificial Analysis’s embedded data. The cost frontier contains 13 configurations from 4 model families. Download that snapshot (JSON).
Fable 5.1 at max effort with fallback has the highest score in this snapshot: 53.37 at $7.63 per task. Astra max scores 52.81 at $3.26. Fable costs 2.3 times as much for 0.56 more index points. The benchmark does not establish how much customers would pay for that score difference. Fable 5 uses its reported fallback configuration.
Cost-conscious margins grow through inference innovation; quality-conscious margins demand upfront capital investment.
Cost-conscious
When several models meet the same requirements, the economic comparison is cost per successful task. Inference innovations reduce serving costs, raising margins at unchanged prices. Better memory management, for example, lets the same hardware serve more requests.
Quality-conscious
When cheaper models cannot deliver the required result, additional capability supports a price premium. Building that capability requires investment in research, compute, and training.
The resulting earnings must recover spending on successful models as well as failed models and experiments.
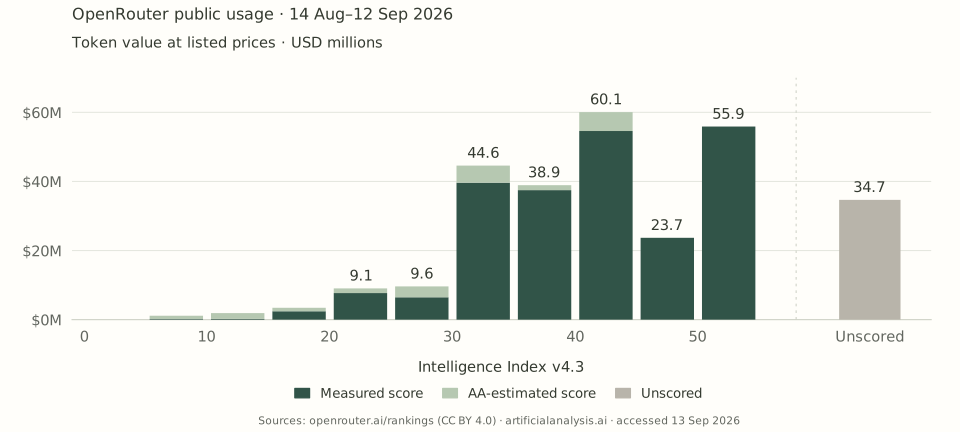
Public OpenRouter usage · 14 August–12 September 2026 · Index v4.3
Model usage is bimodal: smarter vs cheaper.
Among matched models, the two largest score bands are 40–45 ($60.1M) and 50–55 ($55.9M). Substantial usage remains below the frontier alongside demand for the highest-scoring models.

Calculation, coverage & data
Scores cover 87.7% of the $283.0M priced total; $34.7M without matched scores is omitted from the graph and retained in the table and downloads. Another 6.7% of source tokens lack prices and sit outside that dollar total.
We use all 631 routes in OpenRouter’s public monthly rankings snapshot, covering 14 August through 12 September 2026. For each route, value equals prompt tokens times its listed input price, plus completion tokens times its listed output price. The September 13 catalog supplies prices. We match exact canonical model versions and retain each billing variant’s price before combining model totals. Free variants contribute $0; missing prices remain unknown.
Scores use Artificial Analysis Intelligence Index v4.3, retrieved September 13. Each exact release receives its highest measured configuration score. When only AA-estimated scores exist, we use the highest estimate and show it in light green. The scored dollar total covers 79 model releases with measured scores and 93 with estimated scores. OpenRouter does not disclose the reasoning settings of these requests: the horizontal axis describes available model capability, not the score of every request.
Bars use fixed 5-point intervals starting at zero, with the lower endpoint included and the upper endpoint excluded. Unscored models retain their known dollar value in the table and downloads; Tencent Hy4 preview accounts for $28.2M of that total. We do not substitute scores across unverified model updates, including the April and August DeepSeek V4 Pro releases or the August and September Qwen3.8 Max releases.
These are current base-price valuations of public usage, not observed bills. Actual bills also depend on caching, historical prices, provider routing, long-context tiers, negotiated discounts, and request or media fees. The public snapshot reports zero cache-detail fields throughout; it does not establish that caching was absent. The chart does not measure all OpenRouter traffic or all AI spending. Customer motives and provider margins are not measured.
As a sensitivity check, charging 80% of input tokens at the listed cache-read rate where available reduces the priced total to $100.8M. The two largest bands in this scenario are 40–45 and 50–55. This is an explicit pricing scenario, not observed billing or an uncertainty interval.
| Index band | Value at list prices | Share of priced total |
|---|---|---|
| 0–5 | $0.0M | 0.0% |
| 5–10 | $1.1M | 0.4% |
| 10–15 | $1.9M | 0.7% |
| 15–20 | $3.4M | 1.2% |
| 20–25 | $9.1M | 3.2% |
| 25–30 | $9.6M | 3.4% |
| 30–35 | $44.6M | 15.8% |
| 35–40 | $38.9M | 13.8% |
| 40–45 | $60.1M | 21.2% |
| 45–50 | $23.7M | 8.4% |
| 50–55 | $55.9M | 19.7% |
| Unscored | $34.7M | 12.3% |
Download the calculation and model-level data (JSON) · CSV · Graph (SVG)
Source: OpenRouter Rankings, accessed September 13, 2026; usage through September 12. Rankings data are licensed under CC BY 4.0. OpenRouter data documentation · Artificial Analysis benchmark methodology. The download preserves source URLs, retrieval times, checksums, matching decisions, and rows without prices or scores.
Substantial usage below the frontier gives inference improvements a commercial role beyond the newest models. At unchanged prices, lower serving costs improve returns on past development; a new frontier model adds another investment to recover.
Frontier labs can’t afford to keep fighting for first place, and they can’t afford to be second. Staying ahead requires another round of capital investment. Falling behind threatens the premium needed to repay the last one.
Pacing gives frontier investments longer to pay back.
With longer gaps between frontier investments, labs have more time to earn from their existing models. At unchanged prices, inference improvements turn lower serving costs into higher margins.
For a model with unchanged monthly earnings after serving costs, extending its earning life from six months to twelve doubles the money available to repay development.
One AI Futures example sets minimum compute allocations of 70% for serving customers and 25% for transparent safety research, leaving at most 5% for capabilities research and development.
The financial test is whether the extra earnings from existing models and lower development spending exceed added safety costs and the earnings sacrificed by delaying better models.